

Breaking News
HAPPY HALLOWEEN, RECAP OF NOR, OCTOBER RECAP, MOVEMBER OUTLOOK, SOLAR
By Al Mugno
Related Articles
Peeps,
HAPPY HALLOWEEN!!
Here is an oldy but goody halloween joke – “what do ghosts eat for supper? Spooketi LOL!!!
Well Peeps what did I tell ya about the Nor’easter? Up here minimal effects – missed this like the ghost in my old house (since it is Halloween yes it is true and don’t hand me that there are no such things I’d give you 3 instances of ghostly happenings!)but the shore nailed it – they got absolutely pounded and it was the worse coastal flooding since…………………..the 10-29-12 Storm…
 SANDY!!
Photos and statistics
Here is what I had posted but the winds did not come to fruition up in NNJ but did and plus some along the Jersey shore:
The worse of the storm is tonight after midnight through the later morning for our area.
RAIN – 1-3″
WINDS – 20-30 MPH with gusts around 40mph in NNJ
Coast sees 25-35 MPH winds with gusts around 50 maybe 60mph
Flooding – Flash Flood Watches are up and Coastal Flood warning for MODERATE flooding up for tonight through 3PM with the Hunters Moon Wednesday night we still have a 95% full moon with this.
BEACH EROSION LIKELY and POWER OUTAGES POSSIBLE.
MAPS PLEASE
WIND GUSTS


RAIN AMOUNTS

COASTAL FLOODING

WHAT OCCURRED
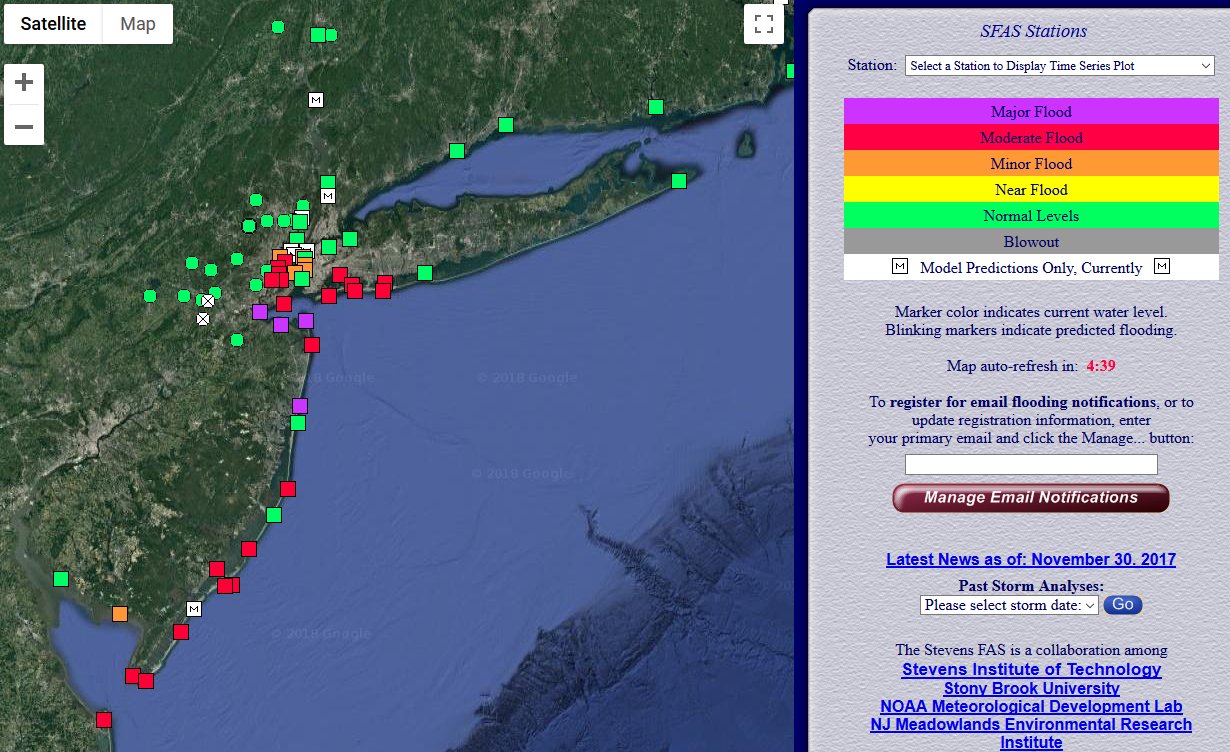
Along the Shark River in Belmar (the gauge is right under to the Route 35 bridge), the Shark River crested at 8.64 feet. That ranks as the third highest on record — above every wintertime nor’easter in 2016, 2017, and 2018, but below Tropical Storm Irene (8.91 feet) and Sandy (13.51 feet).
Watson Creek at Manasquan recorded its fourth highest crest at 7.81 feet, behind Irene (8.27 feet), a storm in the December 1992 (9.38 feet), and Sandy (12.32 feet).
Little Egg Inlet at Tuckerton will also place this storm (6.77 feet) in third place in the record books, behind the Blizzard of 2016 (6.97 feet) and Sandy (10.31 feet).
A few miles inland along the Absecon Creek in Absecon, the measured high tide level of 7.55 feet was only exceeded by Sandy (9.72).

Along the beach in Margate, the tide crest of 7.65 feet falls behind only Sandy (10.43 feet) and a storm in March 1962 (12.13 feet).
I think it’s clear that, while the surge and coastal flooding from “The Nor’easter of October 2018” was impressive and historic, it was nowhere near as catastrophic as that of Superstorm Sandy. The ultimate example is Sandy Hook. Saturday morning, the Sandy Hook gauge peaked in the major flood category at 8.77 feet, about 3 feet higher than the previous day’s high tide levels. Sandy crested at 14.40 feet on October 29, 2012. And that the last measurement recorded before the gauge broke.

WINDS:
The overall wind gust winner was 67 mph, reported 3 miles south of Seaside Park at 8:44 a.m. There were several 60+ mph gusts along coastal Ocean County. = BOYYYAAAAAAHHHHH!!
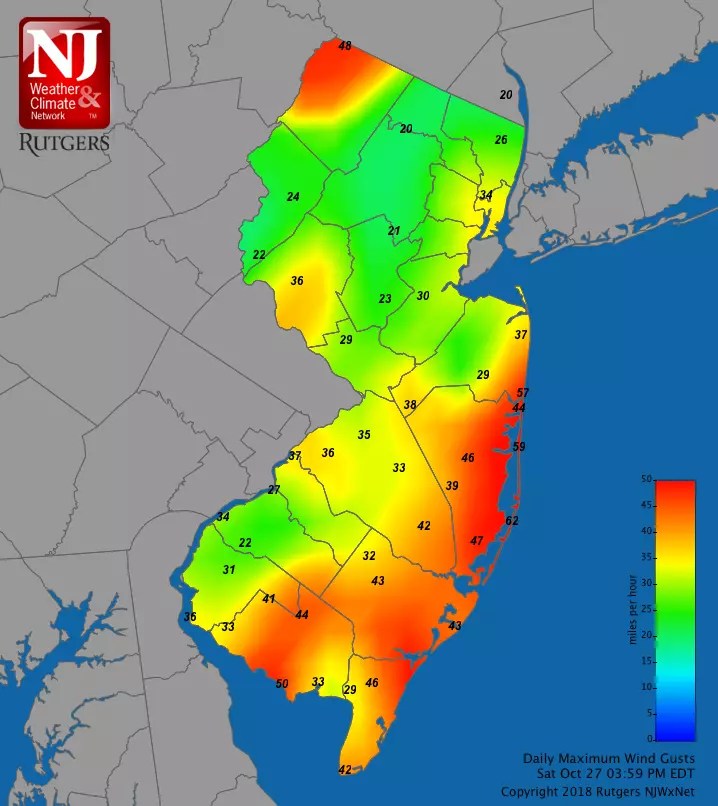
Here are the top wind gusts by county across the entire Garden State:
–Atlantic… Atlantic City Marina (58 mph)
–Bergen… Lyndhurst (34 mph)
–Burlington… Moorestown (36 mph)
–Camden… Pennsaucken (37 mph)
–Cape May… Ocean City (45 mph)
–Cumberland… Millville (40 mph)
–Essex… no data available
–Gloucester… Logan Township (34 mph)
–Hudson… no data available
–Hunterdon… Kingwood (37 mph)
–Mercer… Hopewell Township (29 mph)
–Middlesex…New Brunswick (30 mph)
–Monmouth… Manasquan (58 mph)
–Morris… no data available
–Ocean… Seaside Park (67 mph)
–Passaic… Hawthorne (26 mph)
–Salem… Lower Alloways Creek Township (36 mph)
–Somerset… Hillsborough (23 mph)
–Sussex… High Point Monument (48 mph)
–Union… no data available
–Warren… Pequest (24 mph)
PHOTOS
Pretty wild flooding in Saugatuck, CT. Water was up to my thigh (Im 6 ft for reference). Roads closed due to flooding on the Sound.


So overall I give meself an A- on this storm – nailed the time frame and other factors but missed the sinds up here.
ROCKTOBER Recap
WARM FIRST 14 DAYS AND THEN THE BOTTOM DROPPED OUT FOR THE COLDEST 15 DAY PERIOD SINCE 2002 -OOOP SO SORRY FOR THE CAPS!!
WOW that has been cold!!

A pretty wet month to boot as well:

MOVEMBER
We’ll start off warm teh first few days and then be normal temperature wise 50’s during the day and 30’s at night. Around the 8th a cold shot and very impressive pen comes in till about the 13th and then it may warm up and we get another round of cold air. There is the chance for some white gold in NNJ during this time frame, nothing stikcing except in the high terrain of PB land and Mary L as well as Aunty and Uncle Mikey country. We are monitoring what is called a suddent stratoshperuc warming event that is being modelled to occur around mid to late month. IF this does indeed occur and displaces the Polar Vortex from teh arctic tehre maybe a signal of cold winter like air for around Turkey day through the beginning of Dec to take hold. I am guessing that November will be about Normal temperature wise overall but wet and stormy.
There is a belief in meteorology that where it rains a lot in teh fall it is setting up such a pattern for teh winter – exciting!!
We will see a lot of rain for Thursday through Saturday and warm temps but next week we may the start of a parade of coastal storms. There Is a Scandinavian (love these peeps over tehre) block emerging that if it can retrograde westward it could have what are called downstream effects – this is the block that developed and gave is the King – no not Elvis BUT………the Blizzard of 1996 and 2016!!
BARNEY ALEEET – just for you Joannie M and Momma ( your mother!!)
My disciples from H’dale peeps!
VERY COLD AIR

POSSIBLY?? SNOW AMOUNTS?? the ice berg is building over head and that will have nice implications as winter wears on!!

SOLAR
Your Solar update here peeps
Spotless Days
Current Stretch: 13 days
2018 total: 179 days (59%)
2017 total: 104 days (28%)
2016 total: 32 days (9%)
2015 total: 0 days (0%)
2014 total: 1 day (<1%)
2013 total: 0 days (0%)
2012 total: 0 days (0%)
2011 total: 2 days (<1%)
2010 total: 51 days (14%)
2009 total: 260 days (71%)
2008 total: 268 days (73%)
2007 total: 152 days (42%)
2006 total: 70 days (19%)
Much EQ and Volcanic Activity due to low or No Solar but we aren’t hearing about – to much on teh media agenda than this but tehre have been four 6.0 or greater EQ from Vancouver to New Zealand. Krakatoa had a n explosion this week as well.
Major cold and snow in Europe, Asia and Canada. The siberian snow cover in one week grew by the size of teh continental United States – MOMMA MIA!!
Updates to come.
Al Q
By Al Mugno
