
September Torch
Related Articles
Peeps,
Agter a fall like feel last night where we got down to the lower to mid 50’s and to day a couple degrees below normal at 73* (normal is 75*) we will once again feel the torch of El Nino. It will be in the mid 80’s and possible reach 90* Thursday. If this pattern persists as it is being modeled to do with brief pull backs then we may set the record for the WARMEST Sept on record – YIKES!!!
Take a look at the map here
Huge trough in the west will lead to higher than normal heights over the east.

And if the EURO has its way…we’re not going to see below normal temps for awhile. Will remain average to above for the foreseeable future.
And dry to boot.
El Nino and Sea Ice Extent – say what sea ice?? yes it is that time of year when we start to look at how our sea ice and snow cover is growing in the Arctic region, well I am a bit early but as we get closer to October this becomes a major player going forward for our winter. Here is my post from my board this week on these topics:
Interesting news article today on the USCG icebreaker Healy making it to the North Pole recently [link]. They made the trip a week faster than planned and encountered a lot of rotten ice. From the article:
The scientists aboard Healy tried to gather ice measurements along the journey but were stymied by finding slush instead of solid ice until they were within 100 miles of the North Pole, they said in a Coast Guard press release. “It’s hard to believe how slushy the ice has been so close to the pole; this was the first area we were confident enough in the ice conditions to allow on-ice science experiments,” they wrote. “Despite being thick, the ice we encountered further south was simply too soft and unstable to safely put individuals on.”
Ground-truthing of satellite data is difficult in regions such as the Arctic, but it’s an essential part of validating what the remote sensing data is actually showing
Here is the extent of the sea ice at this time.

You may ask why so early are you posting such information. Well it is this time of year when things are starting to take shape up in the freezer section of the world that will give us our cold air. If it slow in getting going than that much will be delayed with our cold air and winter. There is a direct correlation between this abundance of cold air and the AO. The placement of this sea ice and snow cover is also a factor.
Now we have are the 4th lowest seas ice minimum since records have been kept and have started to even out. There is a cluster of LP systems that are progged to hit Central Northern Siberia.
From another met on this topic – knowledgeable lad – There’s some colder air, though, GFS shows a large area of sub -10C 850s stretching through and across the Arctic Basin, into Northern Greenland and across to the Atlantic side. This bubble of cold air weakens as a high pressure ridge builds into the Arctic next week, pushing more of the cold air into Siberia and away from the Arctic Ocean.
These maps also show a very cold pattern for Central Siberia. A bit off topic, but a cold and stormy pattern in the higher latitudes of Central Siberia should cause drastic increases in Northern Hemisphere snow cover, even if the arctic sea ice is slower to form.
Also, last night Bill Goodman (no relation to John) from the NWS out of Brookhaven gave a 2 hour presentation, discussion on hurricanes and its effects on the forecast area and El Nino and what can or might happen this winter. He stated that the PDO may be waning from a solid positive state to a neutral to negative state. Don’t jump off the bridge yet here peeps for our winter – there is still a massively large body/pool of warm waters in the NPAC the issue being as depicted on SROCs map the cold waters off the Japan island coast. This is due to very active typhoon season in the PAC this summer which has caused tremendous upwelling or mixing of the deep waters of the PAC to rise to the surface cooling that area. We have to wait to see what the next few weeks will bring, if it remains very active and these typhoons stay in the PAC and move into the GOA then the waters will cool even further thus eroding our positive PDO. What implications may this have? This would cause the EPO to go positive if strong enough and thus collapse our ridge out west. The cold air would then get either bottled up in the North Central part of North America.
So as bill said and as frank has said –w wait until the numbers from October come in and we see the trends and pattern. One thing he did for sure is that the STJ is going to be pumping with the strong EL Nino.
On El Nino, the models and indices lag the actual readings. The models can lag by as much as a weeks for actually what is happening at the surface or the depths. So he said that if the Euro shows a weakening in El Nino it may be wrong – SHOCKER! Oh and he said the jury is still out on the GFS. In essence the start and the wanning/slowing down of an El Nino maybe not truly depicted in the chart, graphic met tools we all read – hmm, mother nature doing us in again? How can we now, SROC fire up that boat and take a ride out on the PAC with some instrumentation to see if the models are right – HAHAHA!!
The snow cover extent SAI (Snow Advance Index) reading or indicy is MUCH better tool to use to correlate to the AO. It was stated on here that the correlation between the July NAO would be almost parallel to the winter time NAO reading or measurement. July NAO was negative by 1-2 standard deviations. Also, the waters in the Davis Straight are way above normal, could this help with the NAO – possibly. It sure as heck helped the last couple of winters slowing down our progressive flow to allow for the storms to slow up somewhat.

Orange lines = strong ninos
Blue lines = moderate ninos
The shading is as follows (my subjective interpretation)…
Pink shaded area = East based SST conditions
White area = Basin wide SST conditions
Blue shaded area = Central based SST conditions
Dashed area is the key fall to early winter time frame for winter interests

E= East
C = Central

Enlarge this image Click to see fullsize

Notice the red lines on the chart above – they are earlier forecasts that are higher in the chart, stronger nino period lasting much longer and being stronger as well as we hit December then falling/weaking.
The blue lines are the same forecast models but made in the last week – IF this is correct and only time will tell we seem to have peaked or there about November (hopefully earlier in the month and plausible at that!) which is earlier and not as strong as earlier shown.
Looks to be peaking around November but as Bill Goodman said sometimes the models lag what is actually happening at the surface. I have stated this before on here that IMHO I see a winter that start like this past winter in early to Mid Jan lasting until March. What I read this mornig was that the warmer waters are “going west” (young man) which could put us into what is called a Modoki Nino pattern:
Definition of what a Modoki EL Nino pattern is
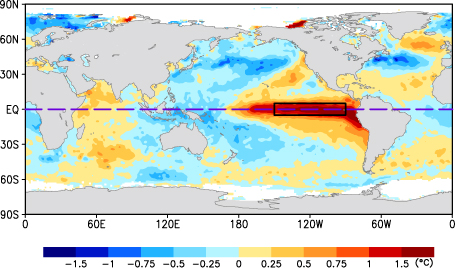
An El Niño Modoki event is an anomalous condition of a distinctly different kind. The warmest SSTs occur in the central Pacific, flanked by colder waters to the east and west, and are associated with distinct patterns of atmospheric convection.
True EL Nino
Modoki
So what does this mean for us IF this is true?
Enlarge this image Click to see fullsize

IT could very well mean a cold and snowy winter! The RED is a Modoki year and look at hose winters – cold and snowy! The analog years again are 2002-03, 2009-10 to look at for a somewhat comparison at this stage.
Snow extent comparisons between the years on Sept 10:
2015

2014

2013

Negligible at this time but this will be closely followed trough the upcoming fall because it is said to have an effect on the AO being positive and negative. Cohen has and is still doing research on this idea.

To reiterate posted above the Blue lines on the images are the most recent model runs and the red lines are the older ones and gray lines are older yet. The thin solid black line was the actual observed value, and the dashed black line is the predicted value based on the avg of all the most recent runs(blue, red and gray lines). Credit for this post goes to Joe Bastardi who posted these images on the Bell on the 11th.
 ” />
” />
Enlarge this image
 ” />
” />
Third image was the most recent from Sept 11th(Never forget).
Enlarge this image
 ” />
” />
So as you can see there is a clear shift/trend to a weaker, albeit still mod to strong values, event over the last 2 months peaking during the Oct, Nov, Dec (OND) time frame. In theory better for the NE. The predicted peak has trended weaker from 3 standard deviations to currently just under 2.5 with the most recent cluster of blue lines below the avg predicted value meaning we MAY cont to see the Nino event trend weaker over the next month or two.
So if we can get a Modoki El Nino albeit 2009-10 and 2010-11 then I think we see the same type of winter.
I”ll be on it here peeps.
Have a great night.
Al Q

Let me tell You a sad story ! There are no comments yet, but You can be first one to comment this article.
Write a comment